


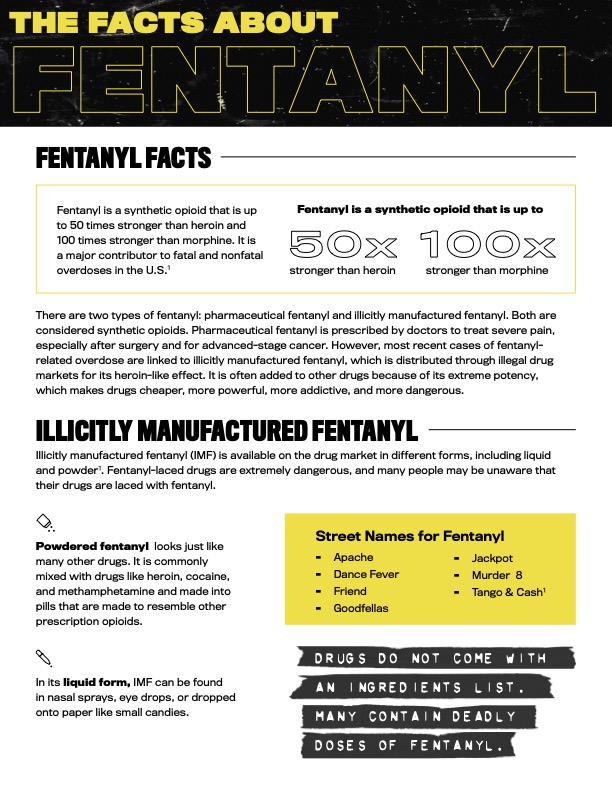
Fentanyl is a synthetic opioid that is 50-100 times stronger than morphine. Many individuals consume fentanyl without their knowledge (because they don’t realize that it is in the drugs they’re using), while others are intentionally using fentanyl because of its potency, effectiveness for pain management, or because they enjoy it.
Fentanyl and other synthetic opioids entering the street drug supply has resulted in a dramatic increase in overdoses and deaths in the US, California and in Nevada County (see images below). In 2024, fentanyl was present in 87% of opioid overdose deaths in California.

Text-based long description of “CDC: Opioid Overdose Deaths per 100,000 population (1999-2023)”
Graph shows three waves of opioid overdose deaths, tracking deaths per 100,000 population from 1999 through 2023.
Wave 1 is the rise in prescription opioid overdose deaths starting in the 1990s.
Wave 2 is the rise in heroin overdose deaths starting in 2010.
Wave 3 is the rise in synthetic opioid overdose deaths starting in 2013.
There are four lines of data tracked on the graph. The first, “Commonly Prescribed Opioids (e.g., Natural & Semi-Synthetic Opioids and Methadone)”, starts in 1999 at ~1 death per 100,000 population. By 2011 this rises to ~5 deaths per 100,000, and remains relatively level until dipping to ~4 deaths per 100,000 by 2023.
The second line of data, “Heroin”, starts near zero in 1999. There is a rise starting in 2010, and reaches a peak in 2016 of ~5 deaths per 100,000 population, before declining to ~4 by 2023.
The third line of data, “Other Synthetic Opioids (e.g., fentanyl, tramadol)”, starts near zero in 1999. It starts to spike upward in 2013, and reaches a peak in 2022 (~23 deaths per 1000,000 population), then slightly declines in 2023.
The fourth line of data, “Any Opioid”, is ~3 deaths per 100,000 starting in 1999. This gradually rises until it hits a peak in 2022 (~25 deaths per 100,000 population), then slightly declines in 2023.
Source: CDC/NCHS, National Vital Statistics System, Mortality. CDC WONDER, Atlanta, GA: US Department of Health and Human Services, CDC; 2024. https://wonder.cdc.gov/.

Text-based table version of “Fentanyl-related Overdose Deaths in CA (2012-2025)”.
| Quarter | Annualized Quarterly Rate | Quarterly Count | 12-Month Rolling Rate | 12-Month Rolling Count |
|---|---|---|---|---|
| 2011 Q1 | 0.29 | 28 | ||
| 2011 Q2 | 0.25 | 25 | ||
| 2011 Q3 | 0.25 | 25 | ||
| 2011 Q4 | 0.25 | 25 | 0.26 | 103 |
| 2012 Q1 | 0.19 | 19 | 0.235 | 94 |
| 2012 Q2 | 0.25 | 25 | 0.235 | 94 |
| 2012 Q3 | 0.19 | 19 | 0.22 | 88 |
| 2012 Q4 | 0.19 | 19 | 0.205 | 82 |
| 2013 Q1 | 0.26 | 28 | 0.222 | 91 |
| 2013 Q2 | 0.19 | 20 | 0.208 | 86 |
| 2013 Q3 | 0.17 | 16 | 0.202 | 83 |
| 2013 Q4 | 0.24 | 24 | 0.215 | 88 |
| 2014 Q1 | 0.26 | 27 | 0.215 | 87 |
| 2014 Q2 | 0.2 | 20 | 0.218 | 87 |
| 2014 Q3 | 0.31 | 32 | 0.252 | 103 |
| 2014 Q4 | 0.24 | 25 | 0.252 | 104 |
| 2015 Q1 | 0.21 | 20 | 0.24 | 97 |
| 2015 Q2 | 0.32 | 33 | 0.27 | 110 |
| 2015 Q3 | 0.29 | 30 | 0.265 | 108 |
| 2015 Q4 | 0.49 | 49 | 0.328 | 132 |
| 2016 Q1 | 0.59 | 60 | 0.423 | 172 |
| 2016 Q2 | 0.6 | 62 | 0.492 | 201 |
| 2016 Q3 | 0.54 | 54 | 0.555 | 225 |
| 2016 Q4 | 0.64 | 63 | 0.593 | 239 |
| 2017 Q1 | 0.89 | 91 | 0.668 | 270 |
| 2017 Q2 | 1.03 | 104 | 0.775 | 312 |
| 2017 Q3 | 1.1 | 111 | 0.915 | 369 |
| 2017 Q4 | 1.21 | 125 | 1.057 | 431 |
| 2018 Q1 | 1.75 | 177 | 1.273 | 517 |
| 2018 Q2 | 1.59 | 163 | 1.413 | 576 |
| 2018 Q3 | 2.41 | 240 | 1.74 | 705 |
| 2018 Q4 | 2.06 | 206 | 1.953 | 786 |
| 2019 Q1 | 2.95 | 298 | 2.252 | 907 |
| 2019 Q2 | 3.318 | 334 | 2.685 | 1078 |
| 2019 Q3 | 4.592 | 459 | 3.23 | 1297 |
| 2019 Q4 | 5.171 | 512 | 4.008 | 1603 |
| 2020 Q1 | 6.862 | 688 | 4.986 | 1993 |
| 2020 Q2 | 9.986 | 991 | 6.653 | 2650 |
| 2020 Q3 | 11.79 | 1188 | 8.452 | 3379 |
| 2020 Q4 | 10.8 | 1079 | 9.86 | 3946 |
| 2021 Q1 | 14.22 | 1389 | 11.699 | 4647 |
| 2021 Q2 | 15.78 | 1533 | 13.147 | 5189 |
| 2021 Q3 | 15.99 | 1563 | 14.198 | 5564 |
| 2021 Q4 | 15.07 | 1476 | 15.265 | 5961 |
| 2022 Q1 | 15.61 | 1530 | 15.613 | 6102 |
| 2022 Q2 | 16.42 | 1594 | 15.773 | 6163 |
| 2022 Q3 | 17.06 | 1661 | 16.04 | 6261 |
| 2022 Q4 | 17.26 | 1688 | 16.587 | 6473 |
| 2023 Q1 | 19.24 | 1802 | 17.495 | 6745 |
| 2023 Q2 | 20.45 | 1907 | 18.503 | 7058 |
| 2023 Q3 | 20.26 | 1879 | 19.303 | 7276 |
| 2023 Q4 | 16.57 | 1549 | 19.13 | 7137 |
| 2024 Q1 | 15.88 | 1484 | 18.29 | 6819 |
| 2024 Q2 | 14.55 | 1341 | 16.815 | 6253 |
| 2024 Q3 | 10.14 | 939 | 14.285 | 5313 |
| 2024 Q4 | 10.81 | 1006 | 12.845 | 4770 |
| 2025 Q1 | 11.66 | 1163 | 11.79 | 4449 |
| 2025 Q2 | 10.67 | 1049 | 10.82 | 4157 |

Text-based table version of “Accidental Overdose Deaths in Nevada County, 2019-2025”
| Year | Accidental overdoses not involving fentanyl | Accidental overdoses involving fentanyl |
|---|---|---|
| 2019 | 18 | 0 |
| 2020 | 17 | 18 |
| 2021 | 25 | 17 |
| 2022 | 15 | 15 |
| 2023 | 15 | 32 |
| 2024* | 17 | 15 |
| 2025* | 8 | 13 |
Nevada County Public Health Department, *2024 & 2025 Preliminary
Locally, fentanyl has been found in methamphetamine, counterfeit pills (Percocet, Xanax, others), cocaine and MDMA (ecstasy or molly), among others. If the drugs you are using were not given to you directly by a pharmacy, they could contain fentanyl.
Narcan, fentanyl test strips, and other harm reduction strategies are important tools in reducing the risk of overdose and death.